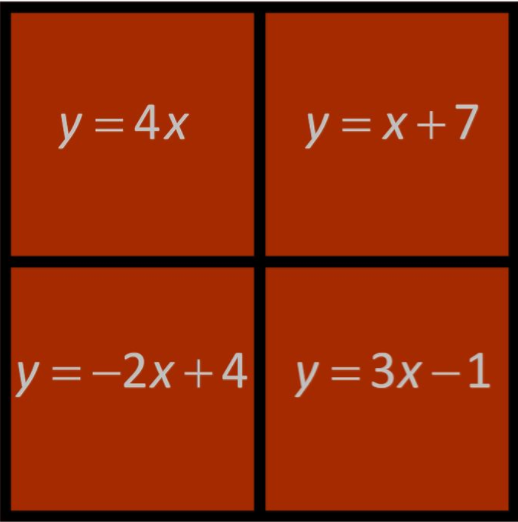
I figured that this would be a bit of a challenge. I knew that students would be able to look at the equations and pick some characteristics out (which they did). I also knew that my students see these four equations differently than I do. When I see these equations I picture the graphs. My students can't do that yet. We've done a lot of graphing of equations but most of that graphing was with scenarios that are concrete and have some meaning. These equations are very abstract.
In any case, I put this up to see what would happen. Right away one student asked for graph paper. Others then started asking if they had to graph it. I told them that they didn't have to. Many said "Wait! What? I don't know how to graph that." I gave them a bit of time to think this one through. I helped a few students who really wanted to be able to graph. We took it up and had some great discussions. I had some superficial type answers (the first one doesn't have a number added or subtracted). I thought I would be disappointed with these types of answers but I really wasn't because each of them led to some talk (led by other students) about what those parts of the equation are, what that means about the relationship and what it means about the graph. The discussions were fantastic. Some of the students were having a hard time connecting all the pieces but it's a conversation we can revisit throughout the semester.
This seemed to be a good time to discuss how we can graph a relationship using a table of values. This was a bit of a leap for some students, which surprised me given the number of visual patterns that we've done and the number of times we've graphed those patterns. I think had I told them that each equation came from a certain pattern, and given the pattern, they would have been fine. We took a step up the ladder of abstraction and talked about how we can create a table of values and plot those point. We did this, together, for the equation in the upper left and then they worked on the one in the bottom right. Did I mention this was just the warm-up? #longestWarmUpEver?
With the warm-up behind us we could move onto connecting slopes, y-intercepts and equations of lines. As it turns out we already had some equations, tables and graphs on the board. We talked about how to find the slope and y-intercept from the graph, from the table and finally they told me how to find them from the equation. My favourite comment of the day: "You mean we can just look at the equation and get slope and y-intercept? We don't have to graph it or make a table?" I think there was some incentive to understand y=mx+b.
I gave them the first two pages of this handout (thanks @MrHoggsClass). Once that was done I handed out some practice on creating tables of values and equations of lines.


No comments:
Post a Comment