We started with a visual pattern today:
It was interesting to see how students counted the number of watermelons in each step. It seemed as though most groups had a couple of different ways of counting which made for some interesting discussions. I think the hardest part here was generating the table of values. Once they had that, groups quickly came up with the equation and the number of watermelons in the forty-third step.
We took up the equations mastery test from yesterday and hopefully cleared up some misconceptions.
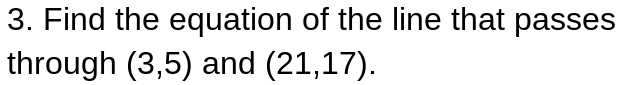
Today's main event was practicing coming up with the equation for a line of best fit. Everyone can draw a line of best fit but when I ask for the equation many students go to their tables to find the slope. When they do this they don't always choose points that are on the line. We need to work on realizing that we want to use points that are on the line to find the equation.
Today we timed to see how long it takes to assemble 5,6,7,8,9 and 10 linking cubes. This is an idea that I modified from Mary Bourassa's Speedy Squares. Rather than making squares we just connected cubes to form a line. Groups worked to collect data. Some groups needed to work on being consistent but got it sorted out pretty quickly. Then they plotted the data and worked to find an equation of the line of best fit. They then practiced using their equation. Here's the handout.
With about fifteen minutes to go we tried the mastery test on solving equations again.
It occurred to me at the end of the period that I don't take enough pictures of students working or of their work. Something to work on. Sorry about the lack of photos.
Showing posts with label equations of lines. Show all posts
Thursday, December 14, 2017
Tuesday, October 31, 2017
MPM1D1 - Day 38 Equations of Lines From Two Points
Hoping to continue our work from yesterday on finding equations of lines we started with this pattern.(with students working in groups up at the board):
Most students are so good at these patterns. I really like their strategy of finding the y-intercept by seeing how much they are off by when the substitute a step number into their equation. I don't want them to lose that intuition but at some point the numbers will become challenging enough that it may be easier to use an equation. I had one group that really struggled with this question but eventually they sorted it out.
When they were done they moved onto the next bunch of questions.
The last question was full of fractions. Many groups seemed fine to keep working with fractions which made me happy. One of the groups kept wanting to change their fractions into decimals and proceed that way. They got a little upset at me for insisting their work be done using fractions (everybody's favourite F-word).
Once they were finished I told them to plot the points and equations for the last two questions in Desmos to see if they got the right answer. Many groups realized that they made a mistake since their line didn't go through the points. They traced back through their algebra to find their errors (often a wrong sign).
Once they were finished I sent groups back to their seats to work on his handout so that they could practice.
I really think that finding the equation of a line that passes through two points is probably the most difficult topic in the course. However, I believe that spiralling the course has really helped. My students have looked at finding equations from tables since the first week of school. We didn't call the parts of the equation the slope and the y-intercept at the beginning of the semester. We had an entire table rather than just two points. But, I really feel like my students have a good understanding of these parts of equations and are now able to hang the proper terminology on their understanding. Students who are still struggling with this concept will have an opportunity to revisit it was we move forward.
Monday, October 30, 2017
MPM1D1 - Day 37 Exponents & Equations of Lines
With Halloween approaching I thought today would be a good day to look at a candy corn estimate. As a side note, I'm not sure that Canadian teens are as fond of candy corn as American teens are. It seems that every year half of my class says that they hate this stuff. Perhaps a more formal study will be necessary.
My students had a three day weekend so I thought I should remind them of some of the exponent work we did last Thursday. We quickly recapped some of the rules and went through some of the challenging homework questions. We also spent some time talking about what it means to have a fraction raised to an exponent. The overwhelming majority of my students wanted to convert the fraction to a decimal then use their calculators. I pushed them to stay with the fractions and write the power as a multiplication statement. Most were able to do that, but again wanted to convert to a decimal and multiply. We got to the point where we had an answer as a fraction, but I think we need to work a little more with fractions so that students are as comfortable working with fractions as they are with decimals.
I also gave this problem:
I figured students would be able to come up with an answer but I asked them to also come up with an answer that involved using exponents. There were some great discussion, and arguments, around the room.
Next, we moved onto writing equations of lines. We've done this before, but there was always a context. I wanted to move away from the context to make this a little more abstract. The goal was to find the equation of a line given two points. We reviewed what the equation of a line looks like and how to find slope. Then we talked about how we could use a point, along with the slope, to find the y-intercept. We worked through an example and then I let them try it. Here's the handout we started with.They didn't have much time so we'll continue with this tomorrow.
Monday, October 16, 2017
MPM1D1 - Day 28 WODB, Tables of Values & Equations of Lines
We started with this Which One Doesn't Belong:
I figured that this would be a bit of a challenge. I knew that students would be able to look at the equations and pick some characteristics out (which they did). I also knew that my students see these four equations differently than I do. When I see these equations I picture the graphs. My students can't do that yet. We've done a lot of graphing of equations but most of that graphing was with scenarios that are concrete and have some meaning. These equations are very abstract.
In any case, I put this up to see what would happen. Right away one student asked for graph paper. Others then started asking if they had to graph it. I told them that they didn't have to. Many said "Wait! What? I don't know how to graph that." I gave them a bit of time to think this one through. I helped a few students who really wanted to be able to graph. We took it up and had some great discussions. I had some superficial type answers (the first one doesn't have a number added or subtracted). I thought I would be disappointed with these types of answers but I really wasn't because each of them led to some talk (led by other students) about what those parts of the equation are, what that means about the relationship and what it means about the graph. The discussions were fantastic. Some of the students were having a hard time connecting all the pieces but it's a conversation we can revisit throughout the semester.
This seemed to be a good time to discuss how we can graph a relationship using a table of values. This was a bit of a leap for some students, which surprised me given the number of visual patterns that we've done and the number of times we've graphed those patterns. I think had I told them that each equation came from a certain pattern, and given the pattern, they would have been fine. We took a step up the ladder of abstraction and talked about how we can create a table of values and plot those point. We did this, together, for the equation in the upper left and then they worked on the one in the bottom right. Did I mention this was just the warm-up? #longestWarmUpEver?
With the warm-up behind us we could move onto connecting slopes, y-intercepts and equations of lines. As it turns out we already had some equations, tables and graphs on the board. We talked about how to find the slope and y-intercept from the graph, from the table and finally they told me how to find them from the equation. My favourite comment of the day: "You mean we can just look at the equation and get slope and y-intercept? We don't have to graph it or make a table?" I think there was some incentive to understand y=mx+b.
I gave them the first two pages of this handout (thanks @MrHoggsClass). Once that was done I handed out some practice on creating tables of values and equations of lines.
Subscribe to:
Comments (Atom)


