Showing posts with label linear relations. Show all posts

Thursday, November 30, 2017

MPM1D1 - Day 59 Knotted Ropes

The warm-up for today was this Which One Doesn't Belong:


It was a nice tie in to what we have been doing (slopes, intercepts, parallel lines) and I heard some great reasons for each one not belonging.

After the warm-up we consolidated the work that we did yesterday on parallel and perpendicular lines. 

The goal for today was to have students explore the relationship between the number of knots in a rope and its length (inspired by this post). Each groups received a length of rope and a length of string. 


They were to create a table, graph and equation to represent both their rope and string, then determine how many knots were needed to make both ropes the same length (same number of knots in each rope). We only had about 30 minutes to complete the activity. I knew that students wouldn't finish but was hopeful. Most groups worked very effectively, but a couple couldn't seem to measure accurately enough. I might need some larger diameter rope that doesn't stretch so much. A number of groups found that their rope was longer after adding a knot to it.

Nobody got past the graphing stage so we'll finish up tomorrow.


Wednesday, November 22, 2017

MPM1D1 - Day 54 Finishing Up Barbie Bungee

Today we finished up Barbie Bungee. A couple of groups wanted to collect more data or double check some of their data from yesterday. Students began analyzing the data. They were creating graphs, both by hand on using Desmos. They were extrapolating using their graphs. They were coming up with the equation of their line of best fit. They were performing linear regressions in Desmos and comparing it to their findings. There was a lot more reasoning about the reasonableness of their answers than I expected. Once students had a number of rubber bands they were happy with they began writing their reports.


With about twenty minutes left we headed to the stairwell to see who could get Barbie the closest to the floor without hitting it. It was so much fun. We had one person at the bottom recording in slow motion. Some students were at the top of the stair watching, while others chose to observe from below. The closest group had Barbie touch the floor with her outstretched hand, but not touch her head. There was some debate about this should count or not. What do you think?


I haven't received a copy of the video yet but once I do I will post it.

What a great end to a great activity. I can't wait to read the write-ups.

Tuesday, September 12, 2017

MPM1D1 - Day 6 More Cup Stacking

I modified the Visual Pattern we did yesterday slightly to see how quickly my students would be able to spot the differences and come up with a solution. Again I asked them to find the forty-third step and a rule/equation to find the number of squares in any step. Here's what we started with:
Most groups started by making a table of values. Those that didn't weren't really sure where to start and so I suggested a table. I was happy to see many groups showing the first differences (though we didn't call them that) in their tables.


 I asked what was the same and what was different compared to yesterday's pattern. It was great hear things like "The constant is different" or "It's going up by the same amount". We talked a little about how these showed up in the equations.

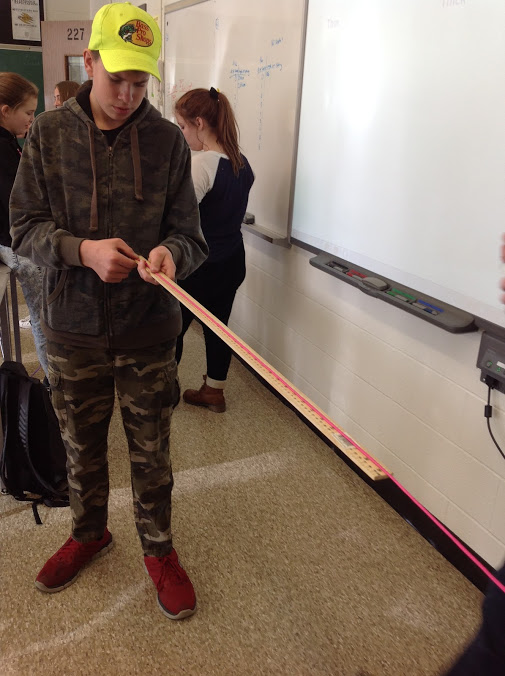
Next we moved onto more cup stacking. The goal for today was to change how we stacked the cups and how that changed the equation and graph. I asked how many cups would be needed (stacked inside one another) to reach R's height. All groups saw that the height of the stack was changing by the lip of the cup for each additional cup. A couple of groups struggled with the initial value. They thought it should be the height of a cup rather than the body of the cup. Every group did manage to come up with an equation but struggled to solve the 2-step equation needed to find the number of cups (not surprising since we have done much equation solving yet).
Once they were done finding the number of cups needed to get to R's height they went back to their seats and plotted Height vs. Number of Cups. We talked about how the graph was different from the one they made yesterday. This led to a need for some terminology (partial vs. direct variation) so we wrote a note about graphs. The note included dependent vs. independent variables, continuous vs. discrete data, lines of best fit and interpolation vs. extrapolation. I was hoping to get into partial and direct variation and slope but we ran out of time.

I gave some homework on plotting points on the Cartesian Plane and identifying whether variables were dependent or independent.

At the end of class I had a student come to me and tell me that he was feeling lost. He said he was able to follow what his group members were saying but he wasn't sure he'd be able to come up with the numbers on his own. He told me that he did well in math last year but wasn't feeling very confident. We chatted for a bit and he agreed to come in tomorrow at lunch so we can go over a few things. I'm curious to see if his issue is related to skill or confidence.