Showing posts with label slope. Show all posts

Wednesday, November 29, 2017

MPM1D1 - Day 58 Parallel and Perpendicular Lines

Today's problem was one that I was reminded of at a recent professional development session (thanks @chrisleechss ).


This question generated a lot of discussion. Is 1 a big slope? Does it matter if it's negative or positive?  There were lots of good conversations as students continued to solidify their understanding of slopes. For groups that finished early I asked how their answers would differ if they were allowed to use the numbers 0-9.

The consolidation of this problem led us to talk about horizontal and vertical lines. We talked (again) about the slopes of these lines but we also talked (unexpectedly) about the equations of horizontal and vertical lines.

The main lesson for today was investigating parallel and perpendicular lines. I gave this investigation. It was good for students to practice graphing lines but I think I need to rework it for them to get more out of the perpendicular lines portion.

We'll consolidate the investigation tomorrow.

Monday, October 16, 2017

MPM1D1 - Day 28 WODB, Tables of Values & Equations of Lines

We started with this Which One Doesn't Belong:


I figured that this would be a bit of a challenge. I knew that students would be able to look at the equations and pick some characteristics out (which they did). I also knew that my students see these four equations differently than I do. When I see these equations I picture the graphs. My students can't do that yet. We've done a lot of graphing of equations but most of that graphing was with scenarios that are concrete and have some meaning. These equations are very abstract.

In any case, I put this up to see what would happen. Right away one student asked for graph paper. Others then started asking if they had to graph it. I told them that they didn't have to. Many said "Wait! What? I don't know how to graph that." I gave them a bit of time to think this one through. I helped a few students who really wanted to be able to graph. We took it up and had some great discussions. I had some superficial type answers (the first one doesn't have a number added or subtracted). I thought I would be disappointed with these types of answers but I really wasn't because each of them led to some talk (led by other students) about what those parts of the equation are, what that means about the relationship and what it means about the graph. The discussions were fantastic. Some of the students were having a hard time connecting all the pieces but it's a conversation we can revisit throughout the semester.

This seemed to be a good time to discuss how we can graph a relationship using a table of values. This was a bit of a leap for some students, which surprised me given the number of visual patterns that we've done and the number of times we've graphed those patterns. I think had I told them that each equation came from a certain pattern, and given the pattern, they would have been fine. We took a step up the ladder of abstraction and talked about how we can create a table of values and plot those point. We did this, together, for the equation in the upper left and then they worked on the one in the bottom right. Did I mention this was just the warm-up? #longestWarmUpEver?

With the warm-up behind us we could move onto connecting slopes, y-intercepts and equations of lines. As it turns out we already had some equations, tables and graphs on the board. We talked about how to find the slope and y-intercept from the graph, from the table and finally they told me how to find them from the equation. My favourite comment of the day: "You mean we can just look at the equation and get slope and y-intercept? We don't have to graph it or make a table?" I think there was some incentive to understand y=mx+b.

I gave them the first two pages of  this handout (thanks @MrHoggsClass). Once that was done I handed out some practice on creating tables of values and equations of lines.


Sunday, October 15, 2017

MPM1D1-Day 27 Desmos Linear Activities

The goal for today was to talk about slope. We started with the Polygraph: Lines activity from Desmos. The idea is that they get paired up with another student in the class. One of them chooses a line from a list, the other asks questions that can be answered with a yes or no to help pick which graph their partner chose. It's basically Guess Who with lines. I wanted to start with this to see if students would use some of the vocabulary we've talked about.


They started right away and got right into it. I saw the use of lots of terminology but not much about what we've talked about. I heard comments about corners rather than quadrants. I heard some reference to the origin. And more than once I saw "Is your line straight?". This one drove me crazy! When I asked "Isn't every line straight?" these students would reply with something along the lines of "Yes, but I mean like this", indicating that they were talking about a vertical or horizontal line. We'll keep plugging away at the terminology.

  I let them play a round or two then brought them back together as a class. I asked which types of questions they found helpful. I then reminded them of some terminology (slope (positive and negative), quadrants) then introduced some new terms for some (x and y-intercepts). They played again and their questions were much better. There were a couple of math fights about wrong answers to questions such as "You said it had a negative slope. That slope is positive."

Once we'd had a bit of experience with the activity we moved onto Polygraph: Lines Part 2. They worked through the activity, hopefully improving their vocabulary and understanding of lines. Some students we motoring through the work, others needed a little encouragaement.

The last activity for the day was Put the Point on the Line, where students have to determine where a third point needs to go in order to be on a line with the other two. The best part about these activities is the teacher dashboard that allows me to see all the work my students have done, even after the fact. I can look the work over and see where the gaps are and then look at providing some assistance in those areas and I have a record that will allow me to see a student's growth over time.

There are lots of other Desmos activities involving linear relations here.

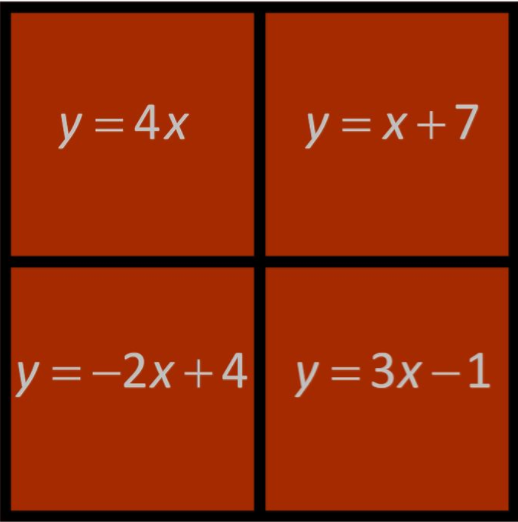
Once they were done the activities we talked about finding the slope between two point on a graph. We've done this before but this was a good reminder. Then we moved into finding the slope without a graph. I gave them this handout to practice with.


Wednesday, September 27, 2017

MPM1D1 - Day 17 Finishing Up Staircase Activity

We started with a few proportions questions as a warm-up. I've noticed that many students are able to solve these questions but they lack structure in their presentation and in explaining their solutions.
I posted these problems on the board and had groups solving the problems at the boards.


I told them to focus on making sure their solution was easy to follow for someone who happened to stop by to read their work. Most students had no trouble doing the work so I had them work on their presentation a bit. We talked as a group about part/part relationships vs. part/whole relationships. We summarized ratios and proportions in their notes and they tried some examples on their own.

We revisited yesterday's work on Staircase and Steepness. Only two students completed the work I assigned for homework. One was able to find a ratio for the base divided by the height that worked. We talked about how the order that his method gave might seem backwards to what would be intuitive. The other student who found a solution went home and taught himself (with the help of the internet) how to use trigonometry to find and angle in a triangle given two sides. I was blown away.

Eventually we settled on the base over the height as a good measure of the steepness. We called it slope. I went back to the suggestion by a student yesterday to put the line on a grid. We looked at how to find the slope then the class worked on practicing solving proportions and calculating slopes.

Tuesday, September 26, 2017

MPM1D1 - Day 16 Introduction to Slope

We started the day with this Which One Doesn't Belong.


The conversations led to a review of some of the terminology that we've covered (quadrants, origin, axes, etc.). One student chose the lower left because it looked different. I asked what he meant. Eventually, he motioned with his hand indicating that it wasn't as steep. Another student helped him find the word steep. We talked about how the other three looked as though they were the same steepness. This led to some discussion about parallel lines and steepness.

My goal today was to introduce the idea of slope. I used Fawn Nguyen's Staircase and Steepness activity. I've used this activity before (with a grade nine applied class I believe) and I seem to remember it working out alright. Today, that was not the case. Students were able to do the first part just fine. They were even keen to measure things. Most opted for a protractor. Those that didn't weren't sure what to measure. After a while I asked how they could come up with a number for the steepness without using a protractor. I threw up Fawn's image so that we were all using the same terminology.

Some students measured the slant. I asked them whether adding a step would change the steepness? The answer was no. Would it change the measure of the slant? They went back to work. Other students wanted to find the base times height. We talked about that being the area and how we could increase or decrease the area by adding or subtracting steps but not change the steepness.

One student suggested putting the steps on a graph like we did for the warm-up. I was liking where this was headed but when I asked how he would determine which was steeper for those that were close he couldn't come up with anything. He was so close.

Many students were starting to pack it in feeling defeated (I wonder if the heat was getting to them). I stepped in and suggested that they look at a bunch of ratios to see if that would help. I told them to divvy up the ratios and complete a table with the ratios for each staircase. This was their homework.

At the end of class I handed back the assessment from yesterday. There were no overall marks on the page. I gave each question a level and students were looking at each question to see where they went wrong. I was hoping to go over a couple of troubling spots but ran out of time. Have I mentioned that it would be great if this class were fifteen minutes longer? We'll do it tomorrow.


Wednesday, September 13, 2017

MPM1D1 - Day 7 Mastery Test, Variation & Slope

I've never done three Visual Patterns in one week, but they seemed to tie in nicely with what we were doing this week. A couple of days ago we did this one:

Then yesterday we did this one:
Today we did this one:

All groups found the equation and the number of squares in the forty-third step easily. I wanted to show this one because we talking about direct and partial variation. We talked about how many squares the 0th step would have. We discussed what the graphs of the three patterns would look like (number of squares vs. step number) and connected an initial value of 0 to direct variations. We also talked about what was the same in all four tables and all four graphs. Somebody mentioned that the values in all the tables were going up by the same amount. Almost all groups had created a column for the first differences, even though we've never talked about it. Somebody else realized that the graphs would be going up at the same angle. We took a few minutes to get some information about direct and partial variations along with some information about slope into their notes.

I was happy to get through this when I did. Today was picture day and shortly after I finished about half a dozen students had to leave and get their photos taken.

The rest of the class did a mastery test on integers. Our department uses mastery tests to get at key skills in a course. They are short ten mark quizzes that focus on very specific but important skills. The idea is that we write the mastery test in class. The teacher marks them then hands them back (usually the next day) and go over any trouble spots. We rewrite a similar mastery test which get marked again. After the second attempt students can rewrite as many times as they want (outside of class time) until they get a mark that they are happy with. In this way the assessment is formative until the student decides it should be summative.

We finished up the mastery test and I handed out a set of data and asked them to create a scatter plot. They had to choose which variables were dependent and independent, create a scale, draw a line of best fit and list the characteristics of the graph (discrete/continuous, partial/direct, positive/negative slope).